Introduction:
In the realm of database management, scaling up complex applications and testing proposed scalability solutions can present daunting challenges. As applications expand in size and complexity, ensuring that the underlying database can accommodate the increased workload becomes paramount. Moreover, companies often can't solely rely on hardware upgrades to solve scalability issues. Additionally, certain performance problems cannot be resolved simply by adding more hardware resources.

Part 1 Summary of “Scaling Oracle: A Data Science Approach to Monitoring Scalability Solutions”:
In my first blog post on this topic, I provided a comprehensive overview of the challenges and strategies for monitoring and testing scalability in an Oracle database using a data science approach. Here's a summary of the key points covered in the post:
I established that scalability is crucial for database management, especially in Oracle databases. The post explores a data science-inspired approach to solving, monitoring, and testing scalability, focusing on feature engineering and feature selection.
I highlighted several challenges that exist in solving, monitoring, and testing scalability in Oracle databases, including the risk of overlooking key observations with small model approaches, unpredictable workloads, and the complexity of monitoring thousands of historic metrics in the AWR.
I introduced the usefulness of feature engineering as it involves selecting, extracting, and transforming relevant metrics and performance indicators from the database system. This process helps in building models, analyzing trends, and making informed decisions regarding scalability and performance.
I also presented the concept of feature selection which involves choosing a subset of relevant features from the original set via anomaly detection. This step helps in identifying metrics and performance indicators indicative of scalability and performance issues.
Lastly, the post highlighted key areas of focus for monitoring and testing scalability in Oracle databases, including contention issues, application efficiency, CPU usage, I/O performance, wait events, connections/session management, transaction management, memory management, REDO management, undo management, temporary tablespace space usage, data size and growth, network performance, and database growth management.
Part 2 of “Scaling Oracle: A Data Science Approach to Monitoring Scalability Solutions”:
This blog post delves into a data science-inspired approach to Oracle performance monitoring. By focusing on anomalies across a broad spectrum of metrics, rather than a limited set, the goal is to avoid overlooking crucial observations and to identify issues before they escalate. The establishment of a problem profile for each major component showcases a dedication to comprehensive monitoring and optimization. Regular review and adjustment of the percentile cutoff and standard deviation thresholds are crucial to maintaining their effectiveness as the application scales up.
I hope to inspire the astute reader to gain insights into how to leverage simple data science techniques to create a sophisticated method for proactively monitoring Oracle database performance. The blog post will cover the methodology, implementation details, and practical considerations for applying this approach in real-world scenarios. Join us to explore how data science can be a powerful tool in solving complex database performance and scalability problems.
Background:
Platform scaling is primarily concerned with managing larger workloads and data sizes, including, for example, involving a theoretical doubling of the current workload. While most databases operate with some adaptive headroom, the question remains: will the anticipated increases in data/query/transaction scale push the workload on the Oracle database beyond its limits? To ensure the database can handle this increased load, a comprehensive approach to testing and monitoring performance metrics, as well as anticipating problem areas, is essential.
Data Science Approach:
The approach I’ve taken represents a step-change paradigm shift away from a small model approach to a large model approach, examining numerous metrics to identify areas where the database is already struggling with the current workload and how it compares to new workloads and data scales. The assumption is that if the database is to encounter issues scaling up, these issues will likely manifest in areas where the database is currently experiencing challenges. By monitoring a wide spectrum of metrics available in the AWR, we gain better insights into changes in application behavior and their impact on the database. This approach is more effective than the small model approach, which risks missing essential observations crucial for scalability analysis.
By identifying key metrics that serve as reliable indicators of performance problems, we aim to go beyond the conventional practice of monitoring a limited set of metrics like CPU, IO, Network, and Memory. Instead, we focus on anomalies and problematic periods, enabling us to identify potential issues before they impact the system's performance.
Top-Down vs Bottom-Up
While a bottom-up approach to solving complex database performance and scalability problems involves addressing each component individually, this method may be too time-consuming for complex systems. A top-down approach, on the other hand, involves examining all time intervals with current workloads to identify potential problem intervals and the application components active during those periods. This approach allows for a more efficient and targeted analysis, particularly when dealing with known problem application components or upcoming major changes.
If you already know of problem application components or an upcoming major change, you can still take the top-down approach, but rather focus in on the known problem intervals rather than all intervals.
A Unique Modular Methodology:
The methodology used in this approach utilizes simple techniques that build incrementally on performance metrics persisted in the AWR. Through adept application of statistical and data science techniques and carefully subsetting the data, we can achieve the level of detail necessary to solve complex database performance and scalability problems. Initially, we focus on 161 metrics from dba_hist_sysmetric_summary, represented as key/value pairs (metric name/metric value) for each time interval. This simplicity allows for easy integration of additional metrics from sources such as dba_hist_osstat, dba_hist_pgastat, dba_hist_system_event, and others including blocking locks, user and SQL level wait events, CPU Time and overall elapsed time, facilitating a comprehensive analysis.

Establishing Cutoffs for Detecting Anomalies:
Anomalies among metric values are flagged by setting cutoff values for each metric, typically using a percentile approach. This approach allows for easy adjustment of anomaly detection sensitivity. Any metric value exceeding the cutoff is considered an anomaly. Using the percentile approach eliminates the need for extensive prior knowledge of metric ranges, as required in the small model approach, where manually establishing cutoffs for each specific metric is nearly impossible when dealing with hundreds or even thousands of metrics.
In the following time-series graph you can see the effect of choosing various percentile values in establishing anomaly cutoff’s. An anomaly would be a metric value above your selected percentile. As you can see choosing a higher percentile makes the model less sensitive. I typically use the 90th percentile as is sensitive enough to catch most important anomalies. Of course, the percentile you use depends on your requirements, for example the 90th percentile might be too sensitive for a monitoring/alerting solution since it would generate some “false positives”.
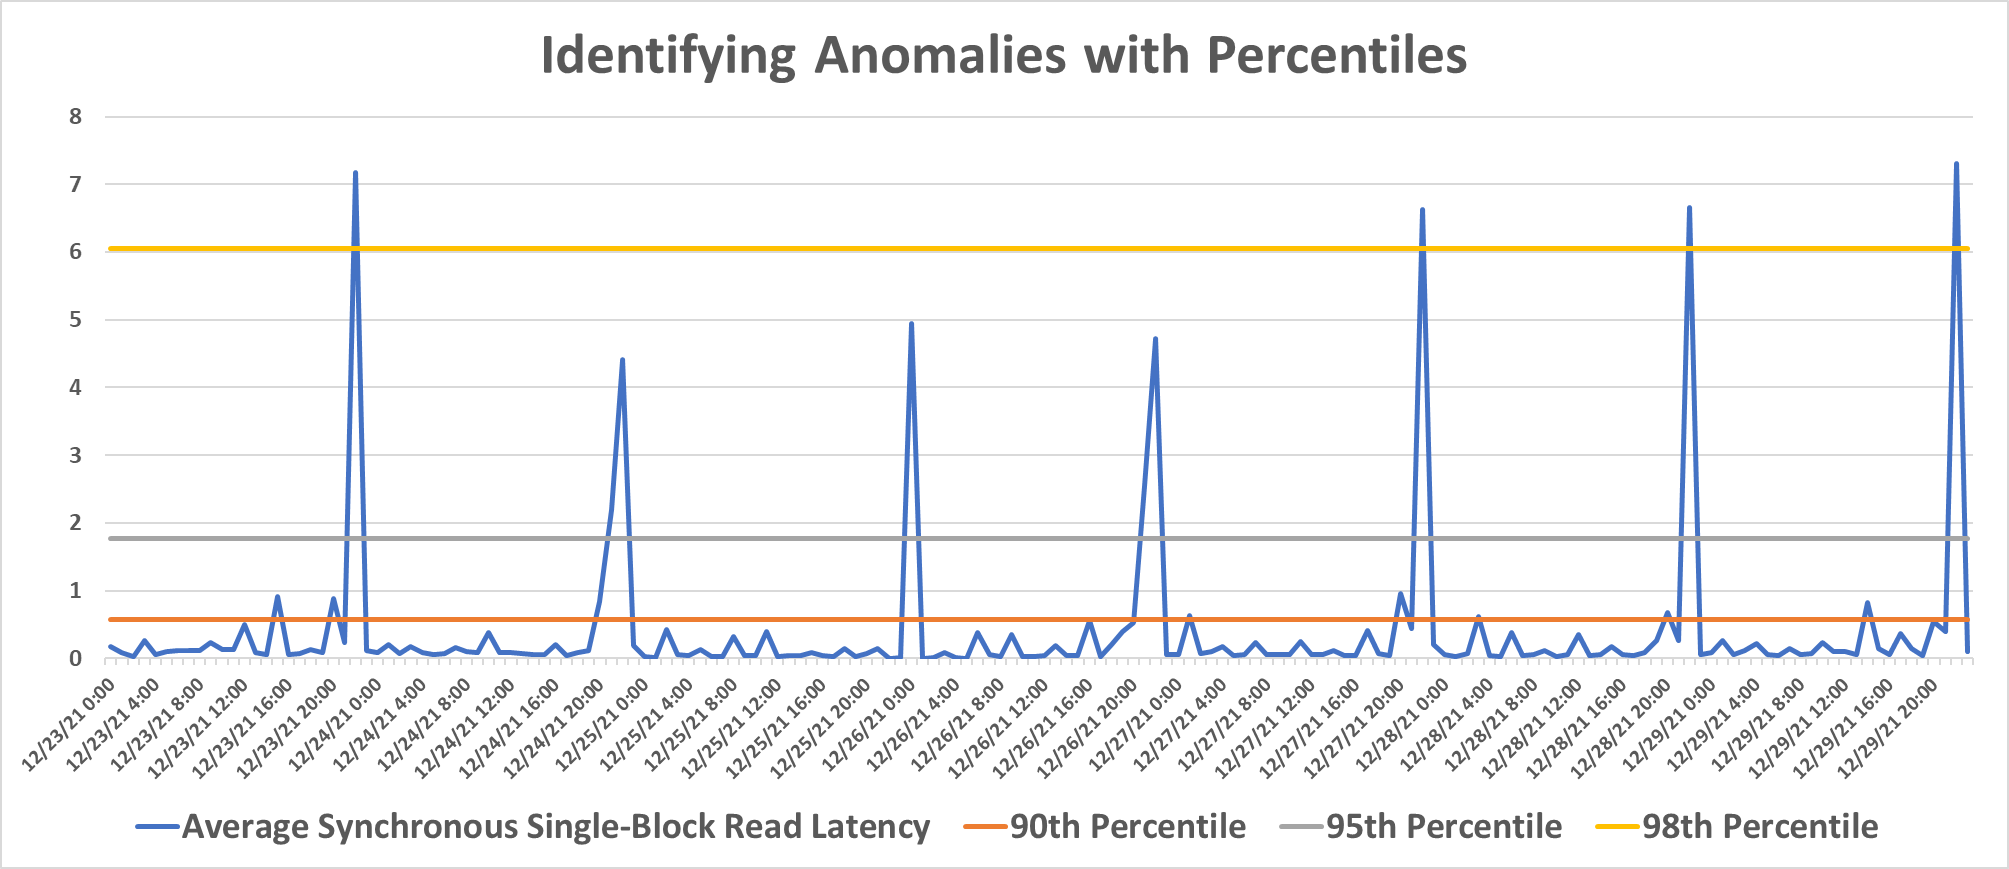
One final thought I’d like to leave you with: there are many possible methods for setting the cutoff value, one popular example is using normal ranges (i.e. plus or minus two standard deviations from the mean), but the sensitivity with the normal range approach is fixed and may result in too many “false positives”, so I don’t use it as often.
Counting Anomalies in a Time Period:
Another data science technique involves counting the number of anomalies in each AWR snapshot interval. Counting the number of anomalies in each AWR snapshot interval is essentially another mechanism that aids in anomaly detection as applied to time-series data. This allows us to identify periods when the database is struggling the most, as a higher anomaly count indicates more database resource issues. Problematic time periods can be mapped to specific application components, facilitating focused analysis.
Identifying Problematic Periods:
By identifying intervals with the highest number of anomalies, we can easily pinpoint problematic periods for deeper analysis. These problematic periods, represented by snap_ids in the AWR, can then be analyzed to understand the SQL statements and application components active during those periods.
Analyzing Application Components for Specific Anomalies:
During problematic periods identified by the snap_ids, the SQL statements running can be queried from the active session history and analyzed to understand the behavior of the database and application components. This analysis helps in building an "application scalability profile" or "potential problem profile" for each major component within the larger application, providing a comprehensive view of potential performance issues.
Implementation:
This methodology is implemented using a single SQL statement built with common table expressions in the with clause. Even on a large production database, it executes in seconds to a couple of minutes depending on how much of the AWR history is queried, making it efficient for real-time monitoring and iterative model building using various customizable subsetting conditions.
Conclusion:
This approach leverages simple data science techniques to develop a sophisticated way to proactively monitor Oracle database performance. By focusing on anomalies among many metrics, rather than a select few, the goal is to avoid overlooking essential observations and to identify issues before they become critical. The development of a problem profile for each major component demonstrates a commitment to thorough monitoring and optimization. It's important to periodically review and adjust the percentile cutoff and standard deviation thresholds to ensure their effectiveness as the application scales up.
That’s it for now. Have a good day!!!